There are some people whose work I dive into greedily as soon as they put something new out. Emma Gannon’s writings are one of them.
I read her book The Multi-Hyphen Method a couple of years ago, and I distinctly remember this:
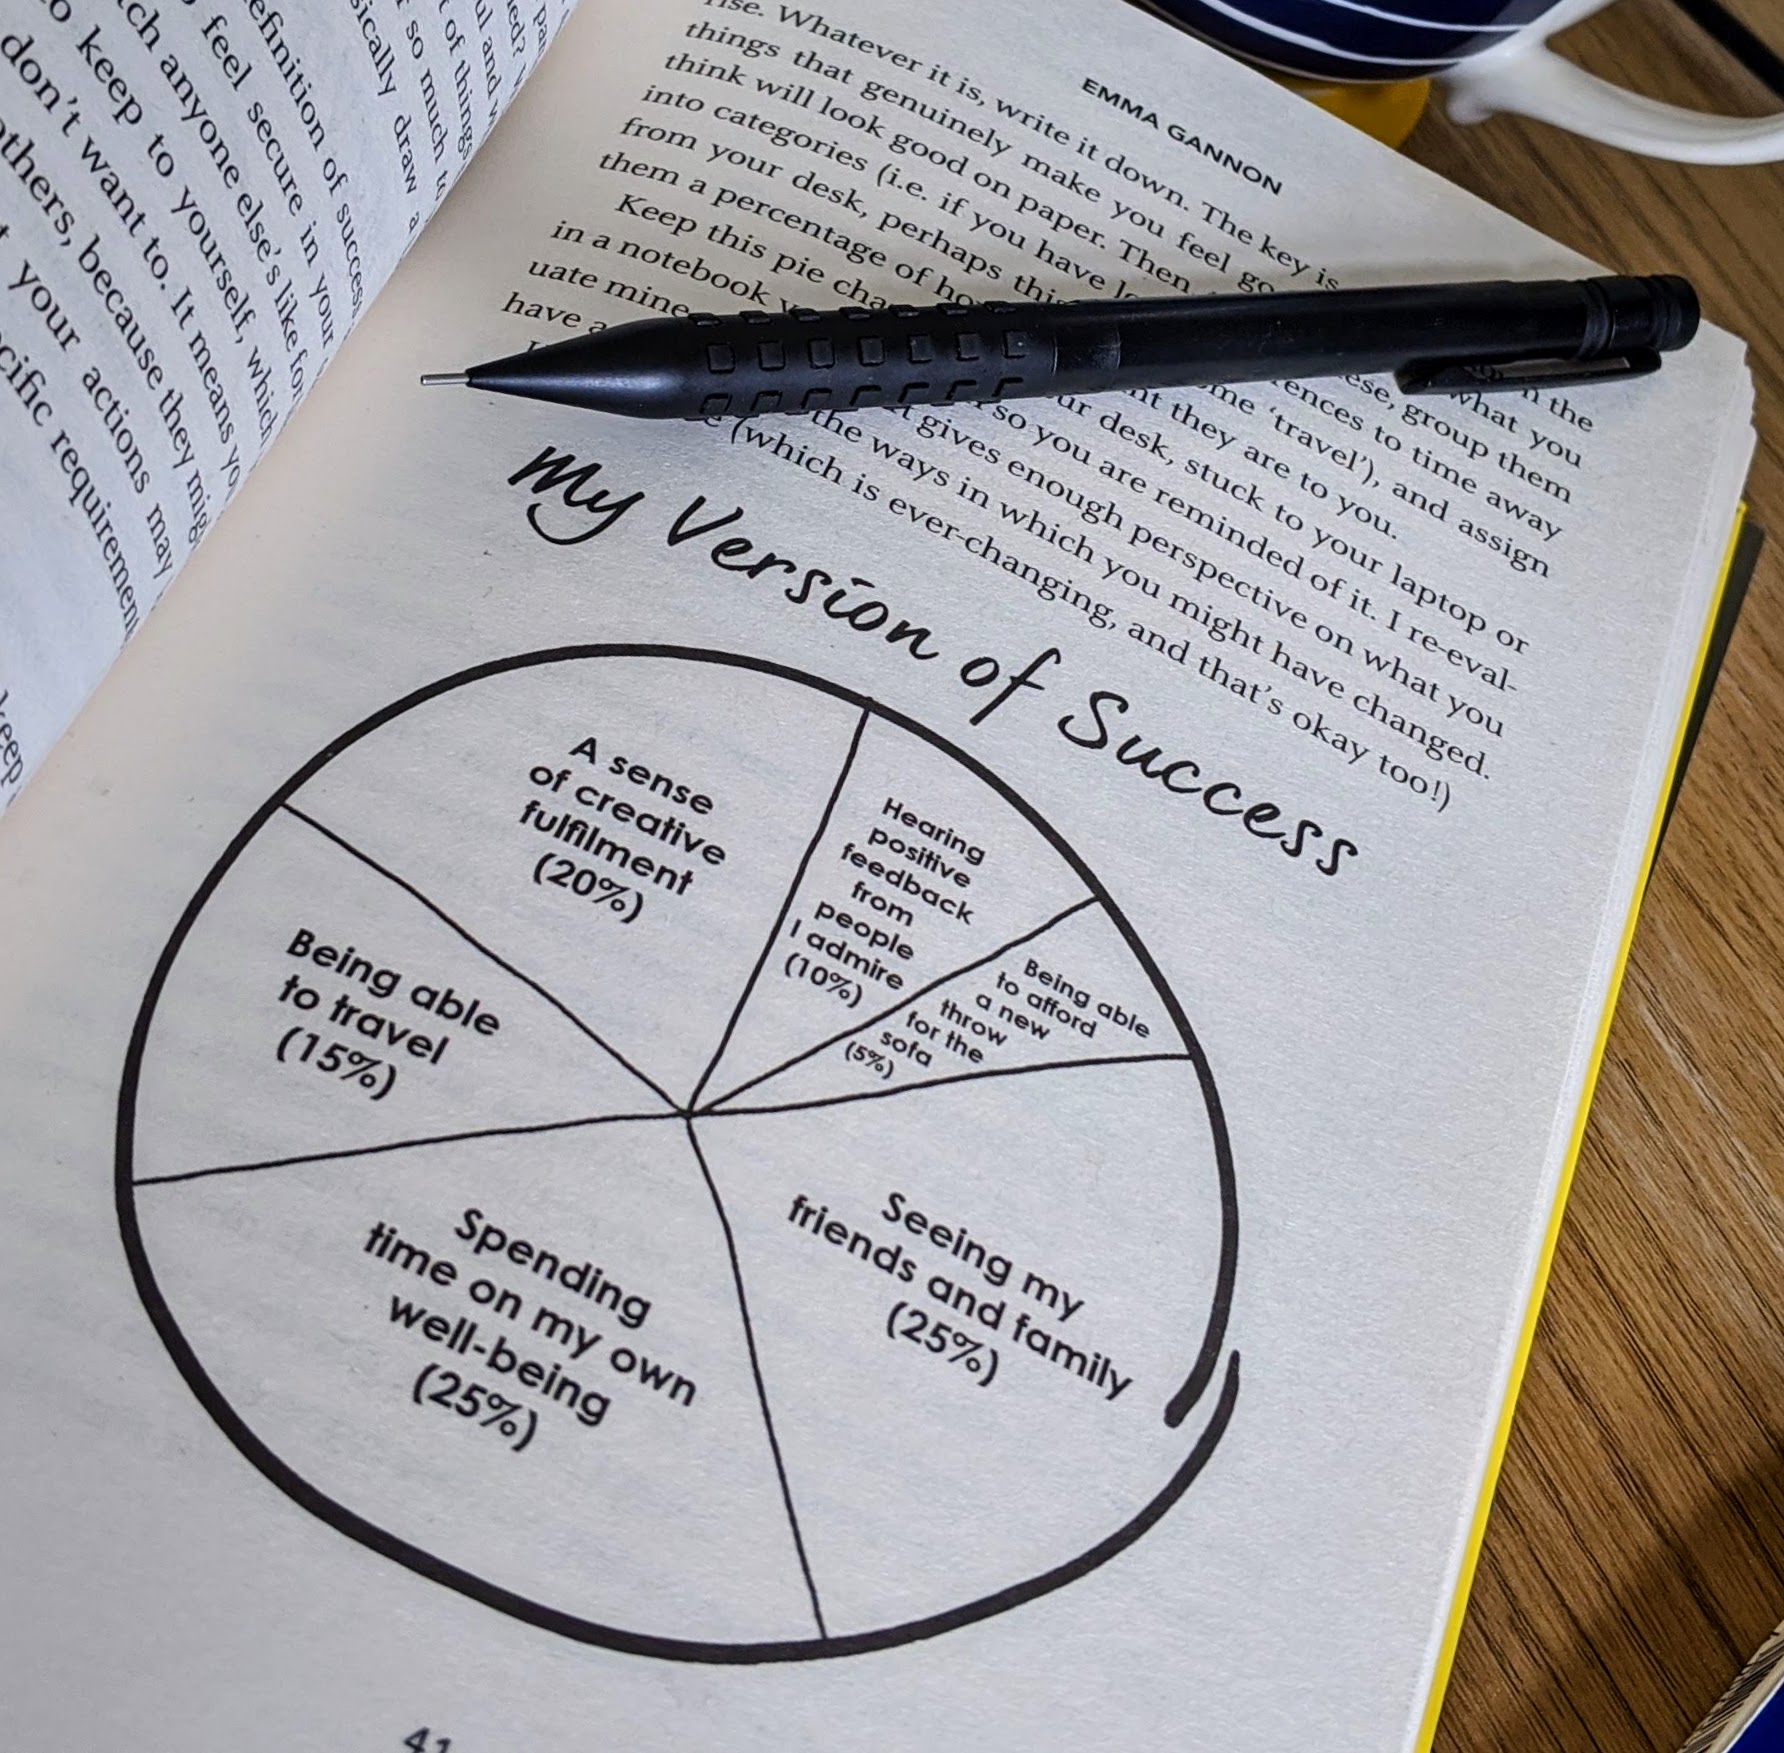
She calls this her personal pie chart. And she advocates that people make their own personal pies in order to figure out what they really want from their life, what their version of success really is.
But a pie chart! No Emma, this is not cool, I thought when I first came across it. Pie charts aren’t visual best practice, and you shouldn’t be persuading people to make charts which don’t let you clearly discern differences in magnitudes between categories.
Except no. I am not snooty enough to think that.
It was more of an “Oh”. Another reminder of the distance between ‘expert’-advocated data viz best practice guidelines, and regular non data-vizzy people.
There are two kinds of people in the data viz world. Pie-chart hardliners for whom pies are ALWAYS THE WRONG CHOICE. The others are those who will tolerate pie charts in exactly 2.5 specific situations but deviating from those rules is just a shameful giveaway that your data literacy is severely lacking.
And then here is me on the periphery whispering: Go on, make a pie, if that’s what makes you happy.
Sure, pies may be the most overused chart type, also frequently misused, angles are hard to decipher, and when you throw percentages into the mix people get even more confused (see specimen here). Those are all valid criticisms.
But despite that I think pie charts are absolutely fine. No judgement.
Because pies have universal appeal. They are a lot of people’s default chart for a reason.

No one gets their geometry set out for this decision.
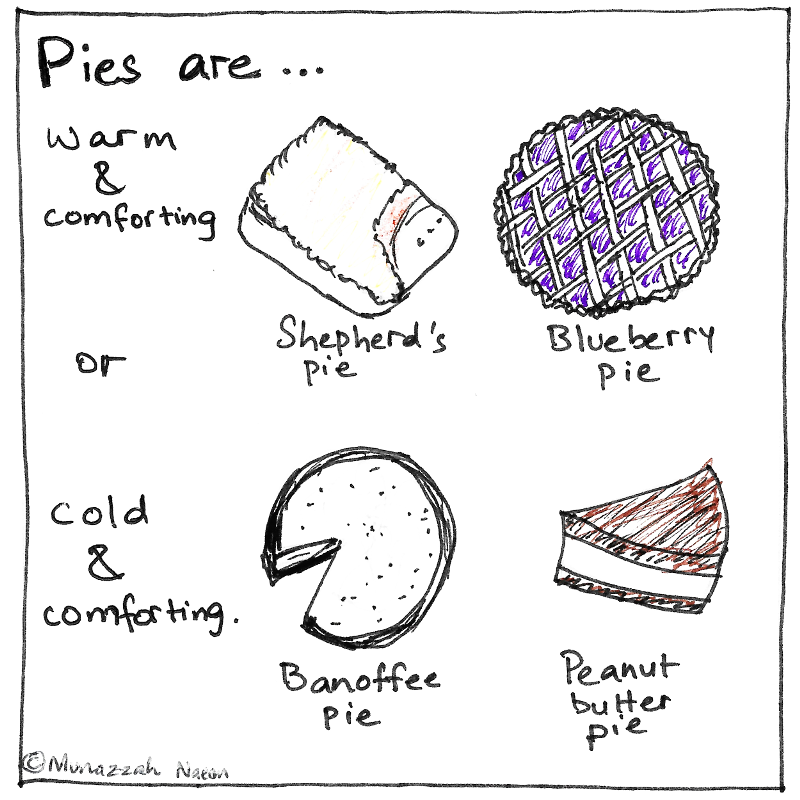

Also, humans just really like circles. Lots of smart people have carried out research into how humans respond to different shapes. Circles (the shape pie charts happen to be) represent to people completeness and familiarity, and the words pleasant and comforting are often associated with them. Circles evoke emotions in a way bars, lines and other shapes just don’t.
One of the common “alright fine but only just this once” pie chart rule is: pies are okay if you are only comparing a couple of categories.
But I don’t like rules.
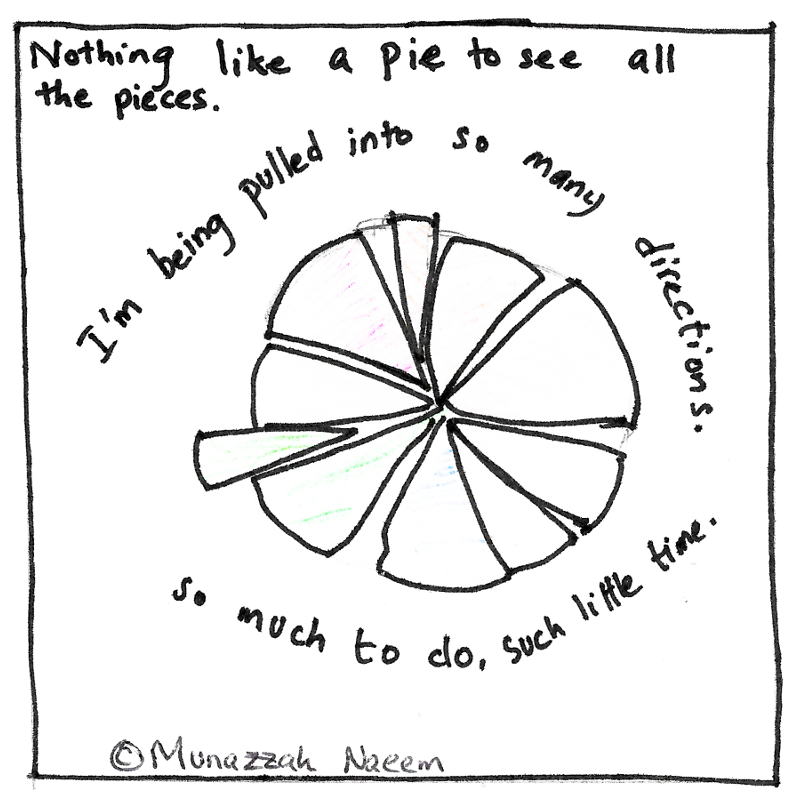
I think pies also work really well when there are loads of categories. In fact pies are amazing at depicting a complete mess! This is my favourite example of a great pie chart use case: when you are visualising utter chaos, aka life with children.
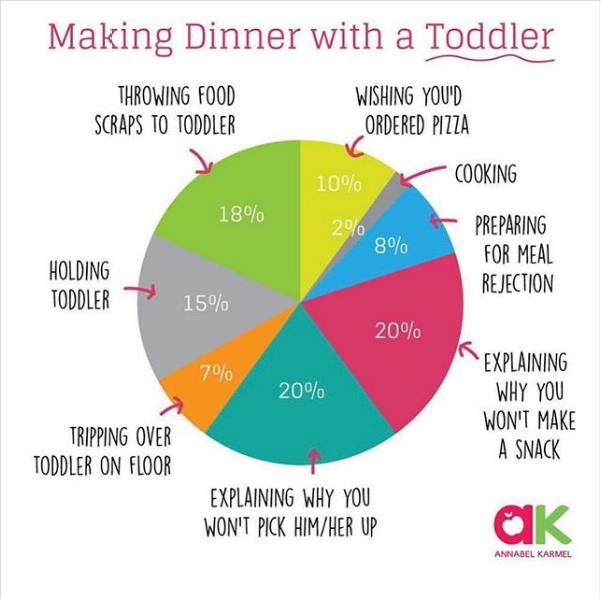
(The people at Annabel Karmel seem to really love pie charts. I counted 16 of them for the past year on their Instagram.)
Nobody cares if the numbers are accurate on these. But the message gets across more effectively than it would with bars (people’s favourite alternative): too much happening all at the same time!
Going back to Emma’s pie. It does a fine job of highlighting the fact that there a whole bunch of things that make humans happy. Loads of different things go into defining success for most people. Life is complicated and messy, and the relative importance of different moving parts in your life cannot be precisely quantified. And perhaps the perception challenges with pie charts are actually really their strength here.
Also pies give you a warm, fuzzy feeling. I mean wouldn’t you much rather compare your life to a pizza or a banoffee pie instead of bars?
But just for the sake of it, I tried different alternatives to Emma’s personal pie.
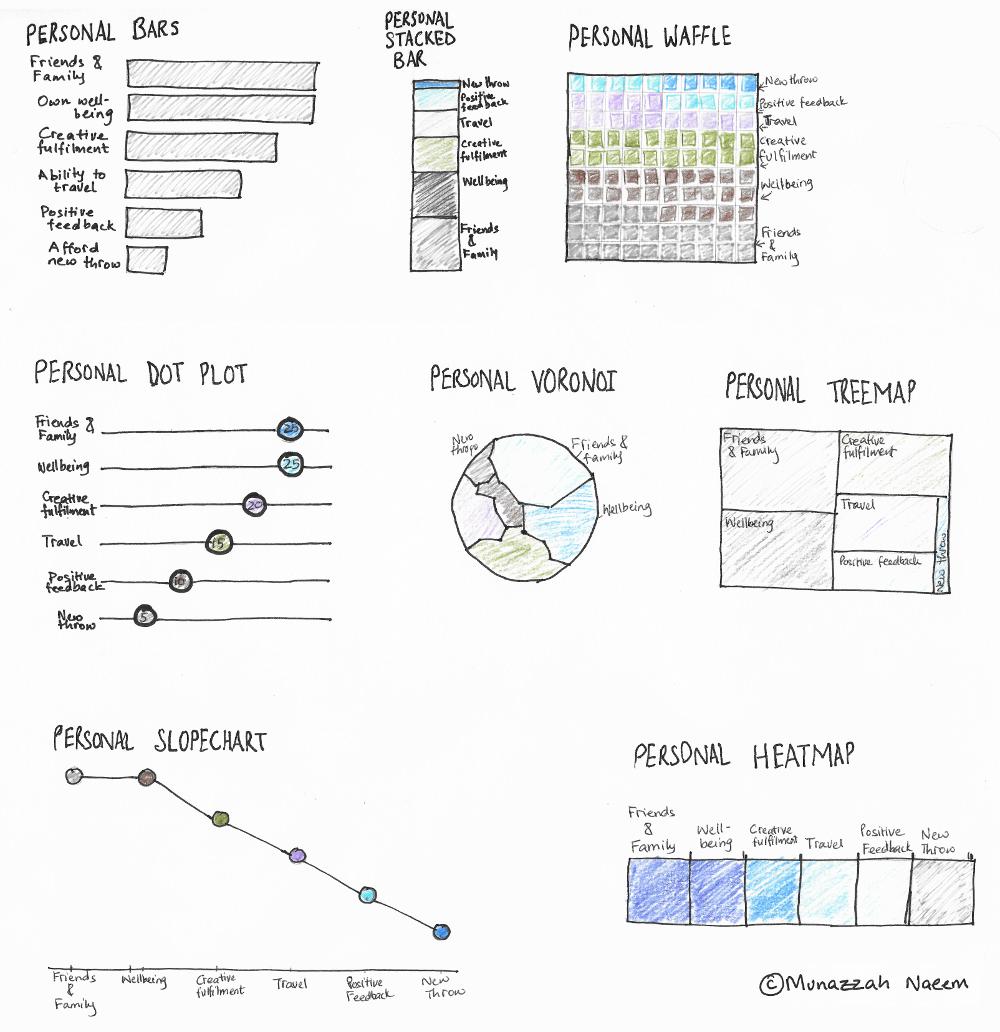
Some of these alternatives aren’t bad, but none have the simplicity, warmth and ease of sketching as the pie. (I can hear you, bar-chart-fanatics accuracy-ninjas, but I don’t agree). I want to see the sum of parts but none of these other options really gives me that in an uncomplicated way.
The pie is just fine.
But why was I even thinking of Emma’s personal pies 2 years after reading the book? Because of this week’s #MakeoverMonday … pizza pie charts.
I completely get YouGov’s thought process in making this (very messed up) chart: We are talking about pizzas. People like pies. Pizza is a pie. Let’s make a pie chart.
I agree, pizza and pie charts, the most natural choice. So here’s my humble pie makeover.

Is it the most precise way to depict this data? Of course not. But as Pete the Cat says, it’s all good.
Disclaimer: I can’t recall the last time I made a serious pie chart myself. Will I anytime soon? Well, who knows where life can take you.