For Mother’s Day, I thought I’d revive an old favourite post of mine which combined two of my favourite activities – taking photographs and fiddling around with charts.
One day, when my son was about 15 months old, I was thinking about how my life pretty much revolved around him and that reflected in probably every conversation I had and every little thing I did. And photos – did I only take photos of him now?
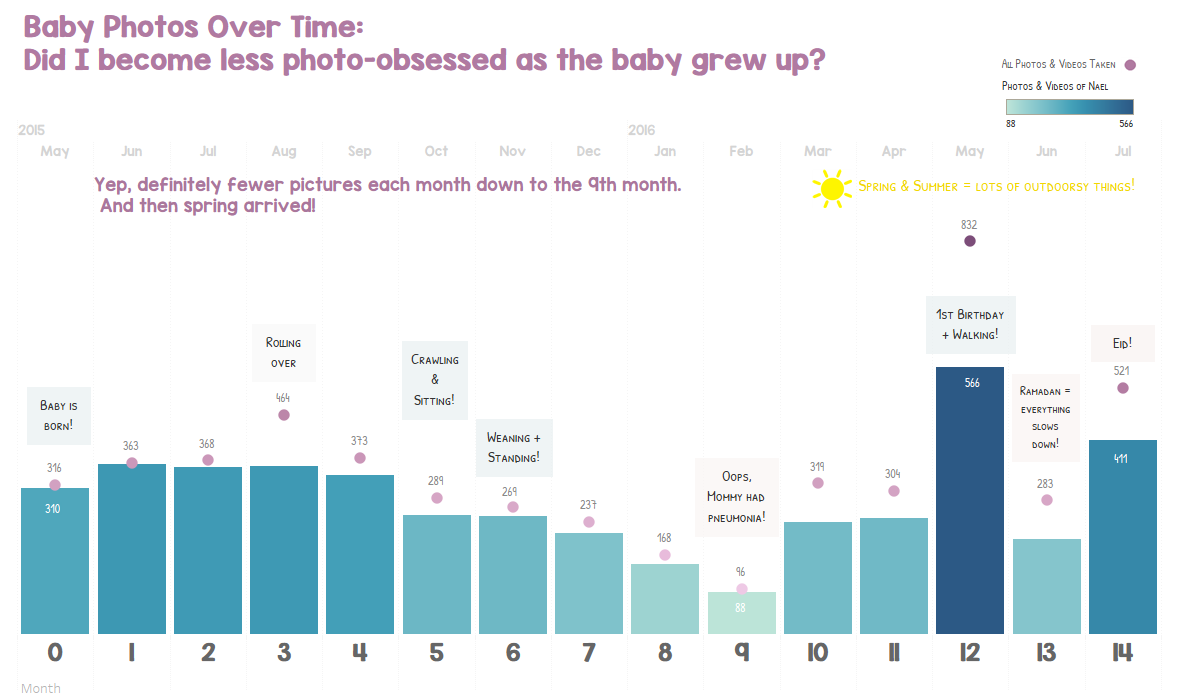
So I sat down and tracked all the photos I had taken since his birth, tagged them, and made a chart out of the data.
Here it is.
I thought I’d update this chart today since my son is almost 3 now (no idea how many months that is, that’s too much mental maths). But then I remembered that I lost about 3 months of photos when my phone died unannounced last May and there went with it all the 600 photos of his second birthday and our trip to the Lake District among all other random everyday cuteness. So I think it’s best I avoid rekindling any more grief about that loss and just leave this chart where it is.
Public service reminder for everybody: please back up your photos regularly, lest you meet a similar fate.